


 47 / 100

February 2016
47
Technical
is another way of explaining it that might
be easier to understand, namely that you
introduce a software ‘RIT’ block at the front
end of your software which effectively QSYs
the receiver audio up or down by up to
±0.5Hz, and you pick out the PPS pulse
after that and derive its phase and feed
that back to the RIT block. Explaining it this
way doesn’t need the reader to have prior
knowledge of I/Q techniques.”
Figure 1
shows a circuit diagram of
the injection network Peter describes. The
resistor and capacitor labelled (*) can be
selected to optimise the level of injection into
your system at the frequencies of interest. A
small value for this capacitor serves as a high
pass filter that will compensate for the natural
roll-off of click amplitude at high frequencies.
It also slightly flattens the amplitude over the
spectrum.
Photo 1
is the output waveform at
the diode, showing the greatly accentuated
spike from the leading edge over that from
the trailing one. Software for using the
ClickLock
idea as a tool for measuring LF
propagation is available at
[1]
. Other ideas
for using it can be found via search engines.
Measuring unknown feeder
At a recent club junk sale I bought a reel
of twin feeder – not ribbon, but the all-
enclosed thinner stuff – and I was hoping it
was 75Ω balanced feeder, useful for making
crossed dipoles. When faced with a length
of unknown feeder, we need to measure its
impedance and its velocity factor (vf). There
are three ways to get Zo (but just one to
determine vf), depending on what access to
test equipment you have.
The first, and most accurate, is RF
measurement. A vector network analyser
(VNA) is the best solution, but failing that
just a VSWR bridge and a transmitter that
can tune over a wide range can do the job.
To measure the feeder characteristics, cut
and accurately measure a convenient length
that will behave as a quarter wave at your
lowest frequency of measurement and half
wave, or better still, a full wave at the highest
frequency attainable. With a VNA a length
of say half a metre allows measurements to
be made in the range 30 – 200MHz, which
is comfortably in the range of most modern
handheld RF test equipment. Using a fully
tuneable HF transmitter will need a test piece
several metres long.
Connect a 50Ω load at one end of the
test piece and measure the input impedance
at the other end. We know that an exact
half wave of transmission line, of any
characteristic impedance Zo, will reflect
whatever impedance it is terminated with
back to the input. So using the VNA, or
measuring the SWR whilst sweeping the
transmit frequency, find the lowest frequency
that gives the best match (lowest VSWR).
This is the frequency at which the test piece
is exactly a half wavelength long, and allows
us to determine the velocity factor. Calculate
the half wavelength in air from Lo = 299.8 /
(2xF) (MHz), so vf = length / Lo.
Now go to a half of this frequency and
measure either the maximum purely resistive
impedance with the VNA or the value of the
maximum SWR. This will occur when the
test piece is exactly a quarter wave long.
The VNA allows the transformed resistance
R’ to be read directly, and the characteristic
impedance of the line is then obtained from
Zo = √(50 x R’).
With just a SWR bridge, there are two
resistances that will give any particular
VSWR reading: these are R’= 50 x VSWR
and 50 / VSWR. However, most lines we
are likely to want to measure will probably
be higher than 50Ω so we can assume the
former equation for now.
Figure 2
shows the plot of my 513mm
test
piece measured using my DG8SAQ network
analyser. The
λ
/2 transformation occurs at
197MHz, which has a half wavelength in air
of 299.8/197/2 = 761mm.
So the velocity factor, vf = 531mm
/ 761mm = 0.70. The quarter wave
transformation resulted in a resistance of
209Ω, meaning Zo = √(209Ω * 50Ω) =
102Ω.
Measuring L and C
If you haven’t got access to a network
analyser and do not have a fully tuneable
transmitter to make VSWR measurements,
a basic LC test meter such as the one by
G4HUP can enable a moderately accurate
measurement of Zo. The idea is to measure
the capacitance between the two cores with
the far end open circuit, and the inductance
between the two with the far end shorted.
Now, this test only works where transmission
line effects do NOT come into play. Therefore
it has to be made at a frequency very much
less that that at which the cable becomes a
quarter wave. LC meters like that typically
measure at 500kHz or lower (wavelength
1600 metres or more) so cable lengths up to
a few tens of metres fulfil that requirement.
The characteristic impedance of a
transmission line is given by √(L’/C’), where
L’ and C’ are inductance and capacitance
per unit length. Since in this calculation the
‘unit length’ is the same for top and bottom
of the division, the actual length of the test
piece is irrelevant – provided it is very short
compared with the test frequency.
Using the full length of cable available for
best accuracy, leave the far end open circuit
and measure the capacitance between the
cores. Then short the far end and measure
its inductance. Then calculate Zo from the
equation above. The values for my length of
feeder (about 20 metres long) were 19µH and
1450pF respectively, so: Zo = √(19 X 10
-6
/ 1450 * 10
-12
) = 114Ω. This is somewhat
higher than the VNA measurement gives, but
close enough. It is not possible to calculate
velocity factor this way, but examination of
the insulation type will hopefully give an idea
of the material, from which vf can then be
looked up. A value around 0.7 is a popular
value for many dielectric materials.
Using a Ruler
Vernier callipers anyway. As accurately as
possible, measure the spacing between
the centre of the two conductors, ‘D’, and
the diameter of one of the cores, ‘d’. If
the conductor is stranded, as mine was,
measuring the diameter can be difficult.
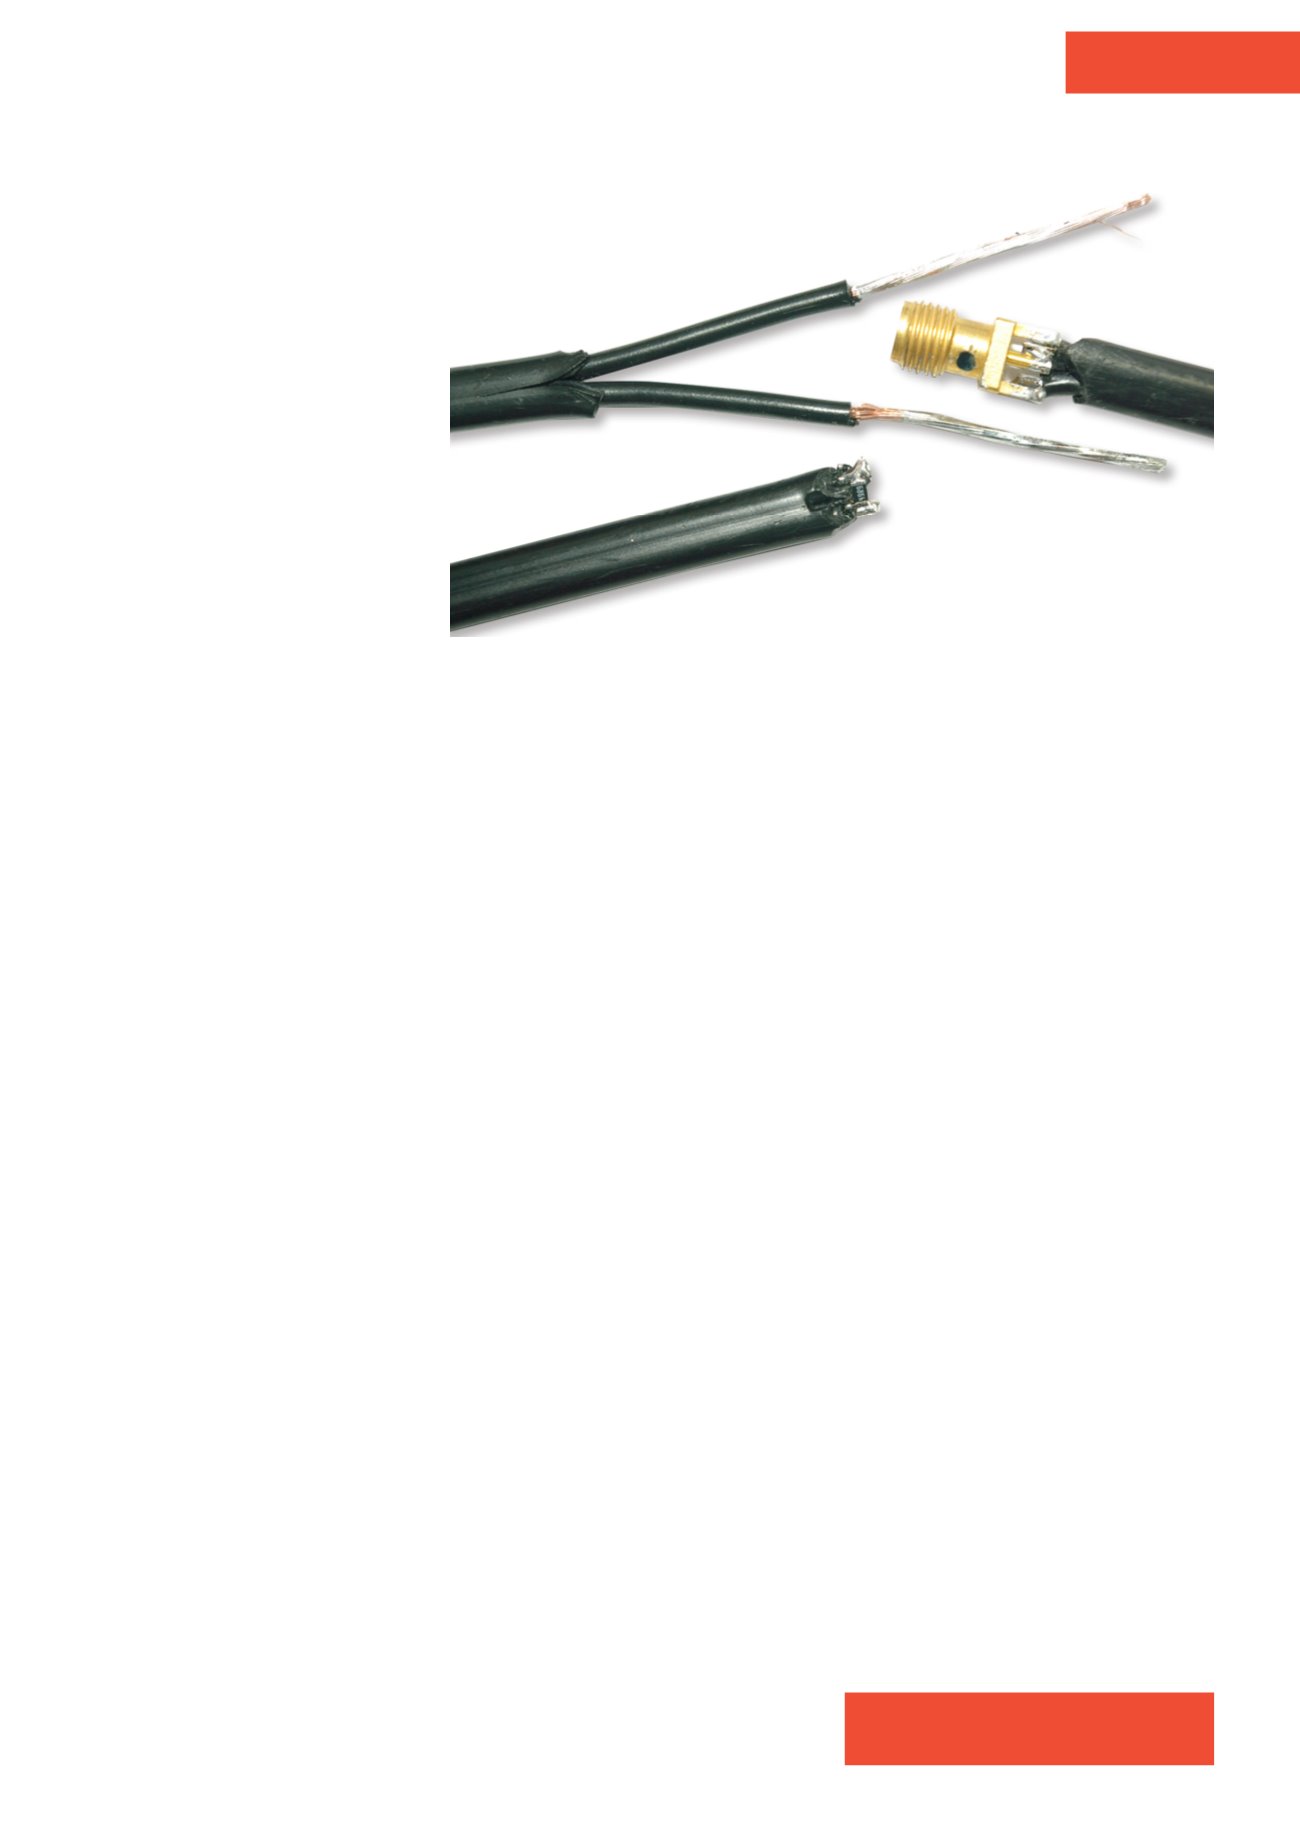
PHOTO 2:
Twin feeder prepared for testing.
Showing ends tinned for mechanical
measuring; soldered to an SMA socket
for VNA connection and, at the bottom, a
49.9Ω SMT resistor used as a test load.
Andy Talbot, G4JNT
ac.talbot@btinternet.com